
XLK VS VGT
Exchange-Traded Funds (ETFs) have transformed the investment landscape, offering investors diversified exposure to various sectors and asset classes. In this article, we'll conduct an in-depth comparison between two prominent ETFs: XLK (Technology Select Sector SPDR Fund) and VGT (Vanguard Information Technology ETF). We'll explore a range of aspects, including ETF tickers, full names, issuers, sectors, top holdings, capitalization, strategy, tracking, and exposure.
XLK Vs VGT: Overview
XLK and VGT are two ETFs that cater to investors interested in the technology sector. While both ETFs focus on the technology industry, they may have nuanced differences in terms of holdings, exposure, and strategy. In this section, we'll delve into the distinct features that set XLK and VGT apart, allowing investors to make informed decisions based on their investment objectives.
XLK Vs VGT: Sectors and Top Holdings
The XLK ETF primarily targets the technology sector, encompassing companies involved in hardware, software, telecommunications, and other tech-related areas. Some of its top holdings include industry giants like Apple, Microsoft, and Visa. VGT also zeroes in on the technology sector but might exhibit variations in its holdings. Understanding the specific sectors and top holdings of these ETFs aids investors in determining their compatibility with the tech-focused investment theme.
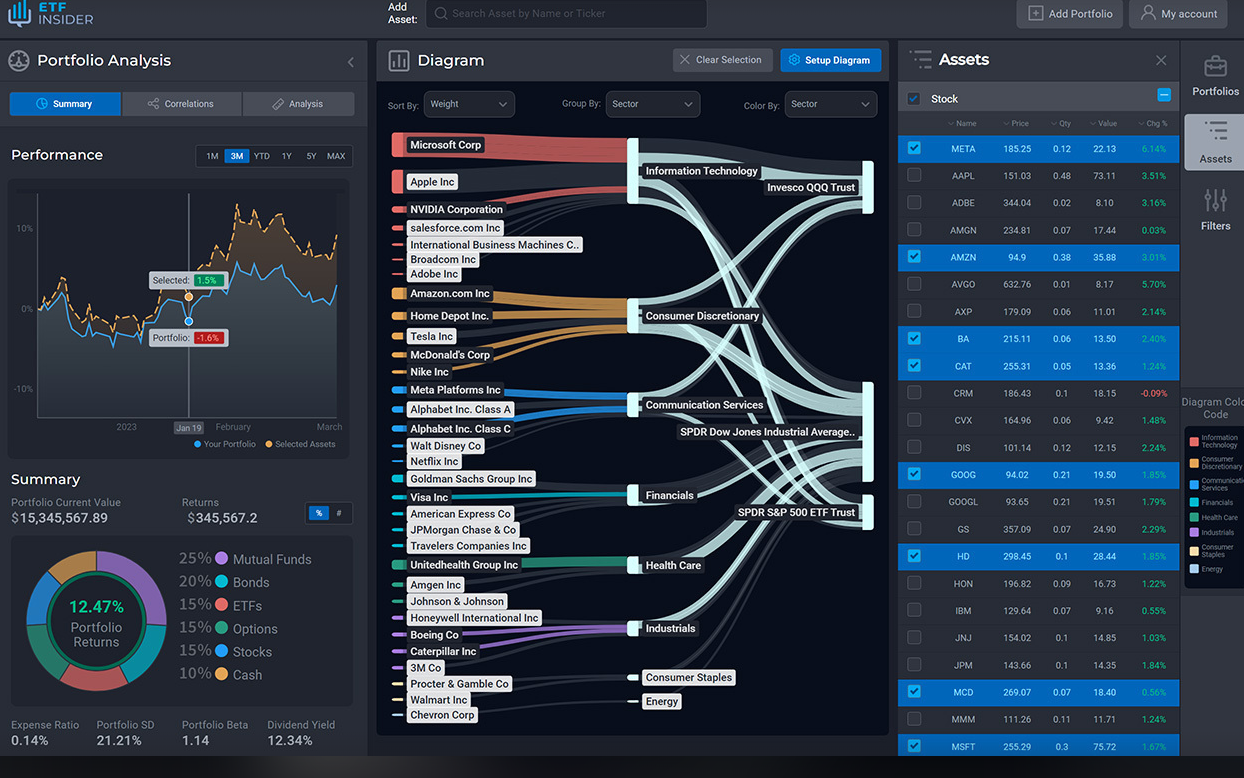 XLK overlap XLK VS VGT
XLK Vs VGT: Capitalization and Strategy
Capitalization and strategy play pivotal roles in evaluating ETFs. XLK typically boasts a substantial Asset Under Management (AUM), reflecting its popularity among investors seeking exposure to the technology industry. VGT's strategy revolves around tracking the performance of the information technology sector as defined by the MSCI US Investable Market Information Technology 25/50 Index. The differences in capitalization and strategy can influence potential returns and associated risks.
XLK Vs VGT: Tracking and Exposure
The tracking mechanisms and exposure strategies of XLK and VGT provide insights into their underlying assets. XLK aims to mirror the performance of the Technology Select Sector Index, while VGT seeks to replicate the performance of the aforementioned MSCI index. Understanding these tracking approaches is essential for investors seeking precise exposure to the technology sector or broader market trends.
Conclusion
XLK and VGT represent distinct opportunities for investors interested in the technology sector. With XLK emphasizing broader technology exposure and VGT focusing on a specific industry index, investors have the flexibility to align their investments with their preferences. For those seeking deeper insights into holdings, correlations, overlaps, and other crucial information, ETF Insider stands as the ultimate tool. This user-friendly app empowers investors to make more informed decisions about their ETF investments.
Disclaimer: This article is intended for informational purposes only and does not provide investment advisory services.
Sources:
XLK quote and analysis
Discover the top holdings, correlations, and overlaps of ETFs using our visualization tool.
Our app allows you to build and track your portfolio.
To learn more about the XLK Technology Select Sector SPDR Fund, access our dedicated page now.
FAQ
Why is XLK better than VGT?
XLK may be considered better than VGT for some investors due to its specific focus, offering diversification.
Does VGT beat XLK?
VGT's performance relative to XLK will vary over time, depending on market conditions.
Should I invest in XLK or VGT?
The choice between XLK and VGT should align with your investment goals, risk tolerance, and desired exposure.
Are XLK and VGT good investments?
Both XLK and VGT can be suitable investments depending on individual investment strategies, goals, and risk profiles.
What is the correlation between XLK and VGT?
The correlation between XLK and VGT can vary over time, reflecting differences in performance.
Related blog posts

XLK VS QQQ | Sectors and Top Holdings
XLK and QQQ stand as prominent players in the ETF landscape, offering investors specialized avenues to tap into the ever-evolving technology sector.

XLK VS CIBR
Compare the XLK and CIBR ETFs with our thorough analysis. Dive into the performance metrics, underlying assets, and investment strategies to see how they stack up against each other. Whether you're a seasoned investor or just getting started, our comparison provides valuable insights to guide your investment decisions.
VGT VS XLK
Compare the VGT and XLK ETFs with our thorough analysis. Dive into the performance metrics, underlying assets, and investment strategies.

QQQ VS XLK
Compare the QQQ and XLK ETFs with our thorough analysis. Dive into the performance metrics, underlying assets, and investment strategies.

VGT VS ARKK
Compare the VGT and ARKK ETFs with our thorough analysis. Dive into the performance metrics, underlying assets, and investment strategies to see how they stack up against each other. Whether you're a seasoned investor or just getting started, our comparison provides valuable insights to guide your investment decisions.

VGT VS CIBR
Compare the VGT and CIBR ETFs with our thorough analysis. Dive into the performance metrics, underlying assets, and investment strategies to see how they stack up against each other. Whether you're a seasoned investor or just getting started, our comparison provides valuable insights to guide your investment decisions.