SOXL VS SOXS: A Comparison of ETFs
Exchange-Traded Funds (ETFs) have transformed the investment landscape, offering investors diversified exposure across a range of sectors and asset classes. In this article, we will undertake an extensive comparison between two notable ETFs: SOXL (Direxion Daily Semiconductor Bull 3x Shares) and SOXS (Direxion Daily Semiconductor Bear 3x Shares). We'll explore key aspects such as tickers, full names, issuers, sectors, top holdings, capitalization, strategy, tracking, and exposure.
SOXL VS SOXS: Overview
SOXL and SOXS are two ETFs with contrasting investment strategies within the semiconductor industry. While SOXL aims to provide three times the daily performance of the PHLX Semiconductor Sector Index, SOXS seeks to achieve three times the inverse of the same index's daily performance. This divergence in objectives leads to distinct exposures and risk profiles, which we will delve into in the subsequent sections.
SOXL VS SOXS: Sectors and Top Holdings
The SOXL ETF is centered on the semiconductor sector, offering investors exposure to companies engaged in semiconductor production and design. Its top holdings include leading semiconductor companies like NVIDIA, Intel, and Taiwan Semiconductor Manufacturing. On the other hand, SOXS is focused on providing inverse exposure to the same sector, effectively allowing investors to bet against semiconductor companies' performance. Understanding the sectors and top holdings of these ETFs is crucial for aligning investments with specific goals and market expectations.
 SOXL overlap SOXL VS SOXS: A Comprehensive Comparison of ETFs
SOXL VS SOXS: Capitalization and Strategy
SOXL exhibits a considerable asset under management (AUM), reflecting its popularity among investors seeking amplified exposure to the semiconductor sector's potential growth. Its strategy involves utilizing financial derivatives to achieve its goal of magnifying the index's daily performance. In contrast, SOXS employs a similar strategy, but with the aim of capitalizing on the semiconductor sector's potential downturns. The differing capitalization and strategies of these ETFs result in varying risk and return profiles, necessitating careful consideration based on an investor's risk tolerance and outlook.
SOXL VS SOXS: Tracking and Exposure
SOXL tracks the PHLX Semiconductor Sector Index, utilizing derivatives to provide three times the index's daily return. This tracking methodology is designed to capture the amplified performance of the semiconductor sector. Conversely, SOXS aims to provide inverse exposure to the same index by seeking three times the inverse of its daily return. These tracking methods offer investors opportunities to profit from both upward and downward movements in the semiconductor sector, but they come with heightened risks due to the leveraged nature of the ETFs.
Conclusion
SOXL and SOXS represent distinct approaches to investing in the semiconductor industry, catering to both bullish and bearish market sentiments. To gain deeper insights into holdings, correlations, overlaps, and other pertinent information, ETF insider stands as a valuable tool. With its user-friendly application, investors can access comprehensive details about these ETFs and other financial instruments, aiding informed decision-making.
Disclaimer: This article does not provide any investment advisory services.
Sources:
Direxion: SOXL Fund Overview
Direxion: SOXS Fund Overview
PHLX Semiconductor Sector Index
SOXL ETF issuer
SOXL ETF official page
SOXS quote and analysis
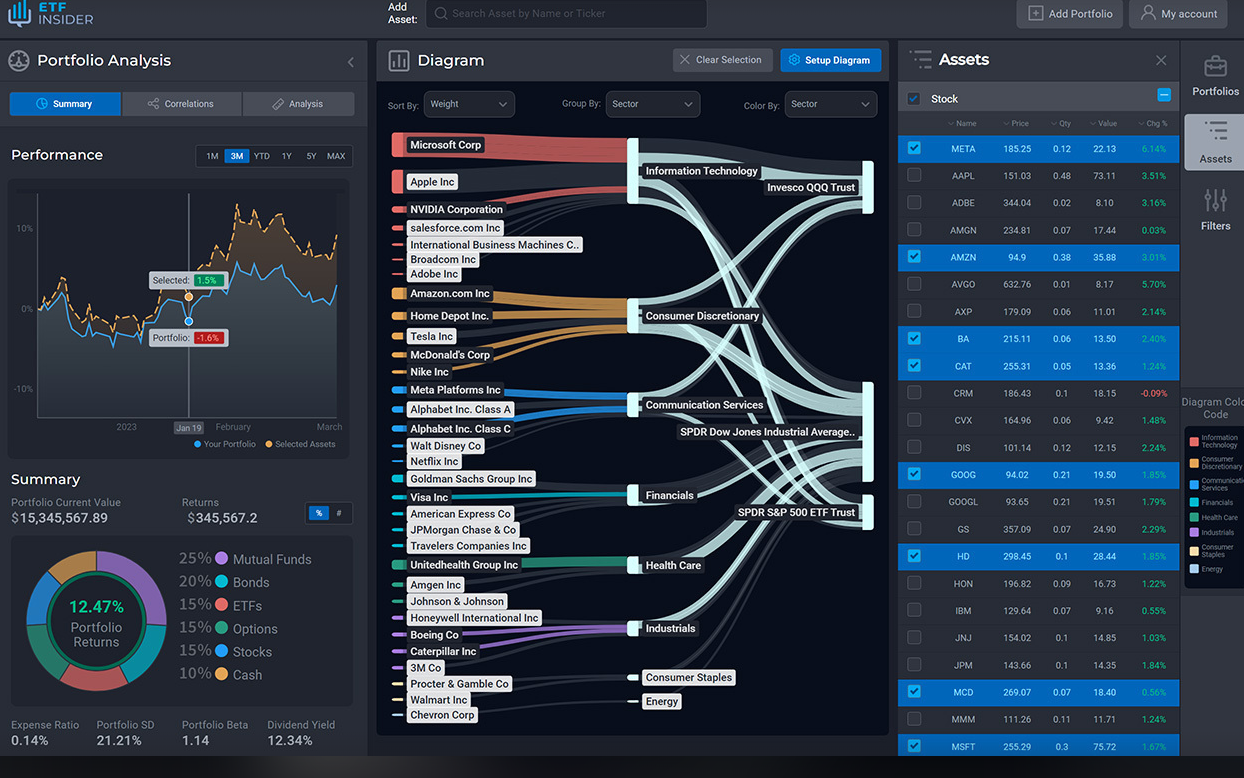
Discover the top holdings, correlations, and overlaps of ETFs using our visualization tool.
Our app allows you to build and track your portfolio.
To learn more about the SOXS Direxion Daily Semiconductor Bear 3x Shares, access our dedicated page now.
Related blog posts

What are the best Semiconductor and Technology Hardware ETFs?
Discover the top-performing Semiconductor and Technology Hardware ETFs that offer investors exposure to the thriving semiconductor industry and the broader technology hardware sector. These ETFs provide a convenient way to diversify portfolios and capitalize on the growth potential of companies involved in the development and manufacturing of semiconductors and hardware components.

What are the best Semiconductor ETFs
Semiconductor ETFs present a compelling opportunity for investors looking to gain exposure to the dynamic semiconductor industry.

What is the SOXS ETF ?
Unlocking the Power of DRN and SOXS ETFs: A Comprehensive Guide. Explore the world of DRN and SOXS exchange-traded funds, their unique features, and potential benefits for investors.

SMH VS SOXX: A Comprehensive Comparison of ETFs
SMH VS SOXX are specialized investment funds that focus on a diverse range of sectors in the financial market. these exchange-traded funds offer investors exposure to various industries and companies, presenting potential growth opportunities and risks. it's essential to understand the underlying assets and strategies of these etfs before considering an investment.

SMH VS SOXL: A Comparison of ETFs
Whether you're seeking a direct, non-leveraged exposure with SMH or aiming for amplified daily returns through SOXL, understanding the nuances of these ETFs.

SOXX VS SOXL: A Comparison of ETFs
SOXX and SOXL offer distinct approaches to investing. To gain insights into holdings, correlations, and overlaps, consider tools like ETF insider.

SOXL VS SOXS: A Comparison of ETFs
Here we'll explore key aspects such as tickers, full names, issuers, sectors, top holdings, capitalization, strategy, tracking, and exposure.

SMH VS BOTZ
Compare the SMH and BOTZ ETFs with our thorough analysis. Dive into the performance metrics, underlying assets, and investment strategies.

How does the SEMI ETF work?
The SEMI ETF is a specialized investment fund that focuses on a specific sector. This exchange-traded fund offers investors exposure to a range of companies in this sector.

SMH VS ARKK
Compare the SMH and ARKK ETFs with our thorough analysis. Dive into the performance metrics, underlying assets, and investment strategies.

SMH VS CIBR
Compare the SMH and CIBR ETFs with our thorough analysis. Dive into the performance metrics, underlying assets, and investment strategies.

SMH VS FDN
Compare the SMH and FDN ETFs with our thorough analysis. Dive into the performance metrics, underlying assets, and investment strategies.

SMH VS FTEC
Compare the SMH and FTEC ETFs with our thorough analysis. Dive into the performance metrics, underlying assets, and investment strategies.

SMH VS IHAK
Compare the SMH and IHAK ETFs with our thorough analysis. Dive into the performance metrics, underlying assets, and investment strategies.

SMH VS IXN
Compare the SMH and IXN ETFs with our thorough analysis. Dive into the performance metrics, underlying assets, and investment strategies.

SMH VS IYW
Compare the SMH and IYW ETFs with our thorough analysis. Dive into the performance metrics, underlying assets, and investment strategies.

SMH VS PSJ
Compare the SMH and PSJ ETFs with our thorough analysis. Dive into the performance metrics, underlying assets, and investment strategies.

SMH VS QQQ
Compare the SMH and QQQ ETFs with our thorough analysis. Dive into the performance metrics, underlying assets, and investment strategies.

SMH VS ROBO
Compare the SMH and ROBO ETFs with our thorough analysis. Dive into the performance metrics, underlying assets, and investment strategies.

SMH VS SOXS: A Comprehensive Comparison of ETFs
SMH VS soxs are specialized investment funds that focus on a diverse range of sectors in the financial market. these exchange-traded funds offer investors exposure to various industries and companies, presenting potential growth opportunities and risks. it's essential to understand the underlying assets and strategies of these etfs before considering an investment.

SMH VS VGT
Compare the SMH and VGT ETFs with our thorough analysis. Dive into the performance metrics, underlying assets, and investment strategies.

SMH VS WCLD
Compare the SMH and WCLD ETFs with our thorough analysis. Dive into the performance metrics, underlying assets, and investment strategies to see how they stack up against each other. Whether you're a seasoned investor or just getting started, our comparison provides valuable insights to guide your investment decisions.

SMH VS XLK
Compare the SMH and XLK ETFs with our thorough analysis. Dive into the performance metrics, underlying assets, and investment strategies.

SMH VS XSD: A Comprehensive Comparison of ETFs
SMH VS XSD are specialized investment funds that focus on a diverse range of sectors in the financial market. these exchange-traded funds offer investors exposure to various industries and companies, presenting potential growth opportunities and risks. it's essential to understand the underlying assets and strategies of these etfs before considering an investment.

SOXX VS SOXS: A Comprehensive Comparison of ETFs
SOXX VS soxs are specialized investment funds that focus on a diverse range of sectors in the financial market. these exchange-traded funds offer investors exposure to various industries and companies, presenting potential growth opportunities and risks. it's essential to understand the underlying assets and strategies of these etfs before considering an investment.

SOXX VS XSD: A Comprehensive Comparison of ETFs
SOXX VS XSD are specialized investment funds that focus on a diverse range of sectors in the financial market. these exchange-traded funds offer investors exposure to various industries and companies, presenting potential growth opportunities and risks. it's essential to understand the underlying assets and strategies of these etfs before considering an investment.