By Educational Department ETF Insider
5 Key Differences between S&P 500 Mutual Funds and ETFs
The five core differences between S&P 500 Mutual Funds and ETFs with the goal of helping you make an informed investment decision.
The Principal Yield ETF (PY) is managed by Principal Global Investors, LLC (PGI), a respected name in the investment industry. Under normal circumstances, this ETF primarily invests in equity securities, with a focus on value stocks. PGI employs a proprietary quantitative model designed to identify mid- to large-cap companies in the S&P 500 Index that offer higher degrees of shareholder yield, which includes dividends and share repurchases. The fund's investment approach is characterized by active and frequent trading, aiming to take advantage of market trends and refine its investment themes using insights from various sources, including internal research, industry reports, and third-party data. As of September 30, 2022, the fund had a significant allocation to the financial services sector, comprising industries such as banking, insurance, and commercial finance.
The PY Dividend ETF, despite not being primarily dividend-focused, does provide investors with dividend distributions. These distributions are typically made on a regular basis, often quarterly, and are influenced by the dividend policies and performances of the underlying companies held within the ETF's portfolio. Since PY includes a mix of stocks from various sectors, its dividend eligibility and distribution may vary, making it a potential choice for investors seeking a diversified income stream alongside potential capital appreciation.
The core strategy of the PY ETF revolves around its tracking index, though the specific index is not mentioned here. PY holds a diverse selection of assets that mirror its benchmark, capturing the essence of various industries and sectors. By aiming to closely align with its tracking index, PY serves as a measure for its respective market segment's performance. Investors often choose PY for its ability to effectively mirror the movements and returns of its underlying index.
The correlation aspect of the Principal U.S. Mega-Cap Multi-Factor Index ETF (PY) is primarily influenced by its investment strategy. This ETF primarily invests in equity securities, focusing on value stocks within the S&P 500 Index. As a result, its correlation with the S&P 500 and the broader U.S. equity market is expected to be relatively high. Investors can utilize PY for diversification and risk management purposes within their portfolios, given its alignment with large-cap U.S. stocks. To gain a more in-depth understanding of PY's correlations with various assets and sectors, investors can use the ETF Insider web app, which offers valuable insights and visualizations for all U.S. ETFs, helping them uncover potential overlaps and investment opportunities.
The PY Sector is primarily associated with the Principal U.S. Large-Cap Value ETF. This ETF focuses on value stocks within the equity market and employs a proprietary quantitative model to identify mid- to large-capitalization companies in the S&P 500 Index that exhibit higher degrees of shareholder yield, considering dividends and share repurchases. As of its last update in September 2022, the fund invested significantly in one or more industries within the financial services sector, such as banking, insurance, and commercial finance. The strategy aims to provide investors with exposure to value-oriented companies in the U.S. large-cap market.
The specific market, regional, and sector exposure of the PY ETF is not detailed here. However, understanding an ETF's exposure is essential for investors aiming to align their portfolios with particular investment goals and risk profiles. For a comprehensive understanding of PY's allocations, the ETF insider tool provides an in-depth analysis through its intuitive web app. This platform not only showcases the ETF's overlap with other assets but also offers valuable insights into correlations and other essential metrics.
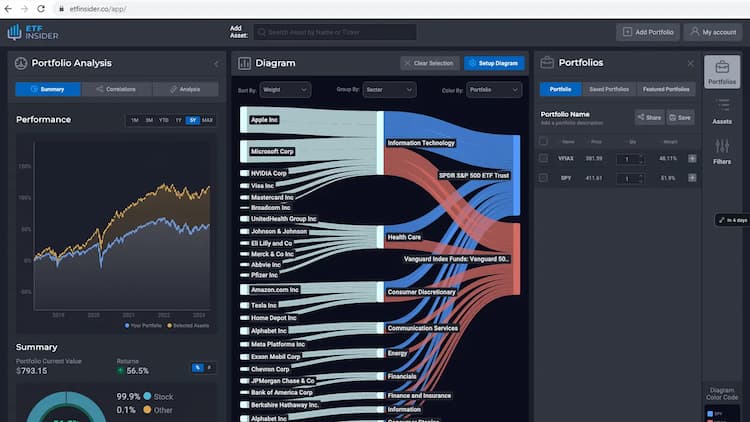
ETF Insider is a data-driven portfolio analytics and optimization platform that introduces a more efficient and practical way to visualize, analyze and optimize portfolios.
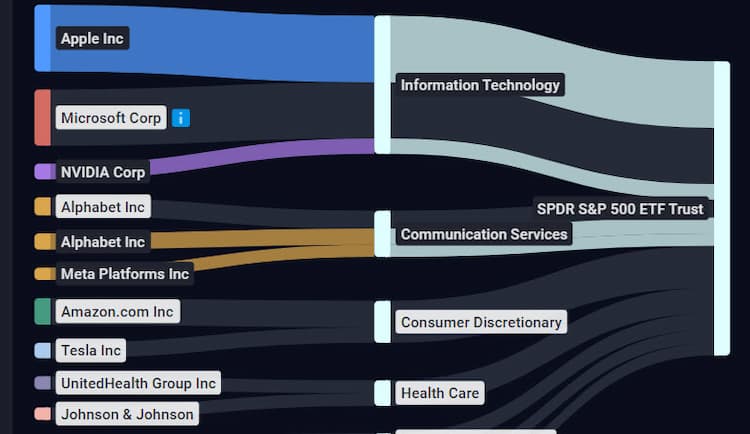
Rather than focusing on the surface-level attributes of ETFs and Mutual Funds, ETF Insider goes deeper by examining the underlying holdings of exchange traded products.
By organizing and structuring that data, investors can easily navigate within their overlapping layers.
This innovative perspective combined with modern data visualization and modeling tools, provides an entirely new approach to portfolio optimization that can quickly expose both portfolio inefficiencies and opportunities.
The five core differences between S&P 500 Mutual Funds and ETFs with the goal of helping you make an informed investment decision.

SPY (SPDR S&P 500 ETF Trust) and IWM (iShares Russell 2000 ETF) are both exchange-traded funds (ETFs) that represent different segments of the U.S. stock market. While SPY tracks the performance of the S&P 500 index, which consists of large-cap stocks, IWM tracks the Russell 2000 index, comprising small-cap stocks. While there may be some correlation between the two ETFs due to overall market movements, their focus on different market segments means they can also exhibit divergent performance at times.
Determining the precise percentage of XBI's holdings in SPY requires accessing the latest information from the official sources of both ETFs.
ETF Insider is a novel portfolio optimization tool that uses the power of data visualization to gain insight into portfolio compositions, concentration risks, portfolio efficiency and more. Complex financial data can be transformed into visually appealing and easily digestible graphs and charts, allowing investors to quickly identify trends and make well-informed investment decisions. Not only does this save time, but it also increases the accuracy and effectiveness of portfolio management.