XOP ISSUER
The SPDR S&P Oil & Gas Exploration & Production ETF (XOP) is managed by SSGA Funds Management, Inc. (SSGA FM), the investment advisor to the Fund. SSGA FM employs a sampling strategy to track the performance of the S&P Oil & Gas Exploration & Production Select Industry Index, aiming to hold a portfolio of securities with similar risk and return characteristics to the Index. The Index, sponsored by S&P Dow Jones Indices LLC, comprises companies from the integrated oil & gas, oil & gas exploration & production, and oil & gas refining & marketing sub-industries, meeting specific market capitalization and liquidity criteria, and is reb
XOP DIVIDEND
The SPDR S&P Oil & Gas Exploration & Production ETF (XOP) focuses on tracking the performance of the S&P Oil & Gas Exploration & Production Select Industry Index. While not primarily a dividend-focused ETF, XOP reflects the dividend distribution of the underlying index. Dividend eligibility within XOP is contingent upon the dividend policies of its constituent companies, which are primarily in the oil and gas exploration and production sectors. These distributions typically occur quarterly and are influenced by the performance of the individual companies within the index.
XOP TRACKING
XOP Tracking follows the S&P Oil & Gas Exploration & Production Select Industry Index, which comprises companies involved in the exploration and production of oil and gas within the United States. The ETF utilizes a sampling strategy, selecting a subset of securities from the index to closely mirror its risk and return characteristics. It generally invests at least 80% of its assets in securities from the index and may also include additional equity securities, cash equivalents, or money market instruments. XOP aims to provide investors with exposure to the performance of the oil and gas exploration and production sector while maintaining liquidity and market cap requirements set by the Global Industry Classification Standard (GICS). As of its last rebalancing, the index consisted of 59 stocks, representing various segments within the industry.
XOP CORRELATION
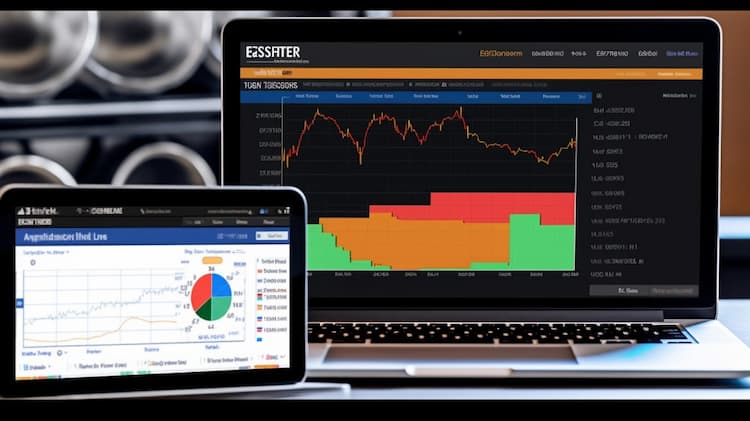
Understanding the correlation dynamics of the SPDR S&P Oil & Gas Exploration & Production ETF (XOP) is essential for investors navigating the energy sector. Given XOP's focus on oil and gas exploration and production companies, its correlation with energy prices, geopolitical events, and global demand trends is notable. Analyzing XOP's correlation with crude oil prices and broader market indices can provide insights into energy sector performance and assist investors in making informed decisions. For deeper insights into XOP's correlations and sectoral trends, investors can leverage the ETF Insider web app, offering comprehensive data visualization tools and precise overlap analysis for a holistic understanding of market dynamics.
XOP SECTOR
The XOP (SPDR S&P Oil & Gas Exploration & Production ETF) primarily focuses on the energy sector, specifically companies involved in oil and gas exploration and production. This sector includes businesses engaged in the discovery and extraction of crude oil and natural gas. XOP's portfolio consists of companies across various sub-industries within energy, such as integrated oil & gas, exploration & production, and refining & marketing. Investors in XOP seek exposure to the performance of these energy companies, which can be influenced by factors like oil prices, global demand dynamics, and geopolitical events. Given the volatile nature of the energy sector, investing in XOP entails exposure to fluctuations in commodity prices and regulatory changes impacting the oil and gas industry.
XOP EXPOSURE
The SPDR S&P Oil & Gas Exploration & Production ETF (XOP) provides exposure to the oil and gas exploration and production segment of the U.S. equity market. By tracking the S&P Oil & Gas Exploration & Production Select Industry Index, XOP offers investors a way to participate in the performance of companies engaged in the exploration, production, and refining of oil and gas. With its focus on this specific industry subset, XOP allows investors to take advantage of opportunities and potential growth within the energy sector. For detailed insights into XOP's exposure, investors can utilize ETF Insider, a comprehensive web app offering deep analysis and visualization tools to uncover correlations, sector allocations, and potential overlaps within XOP's holdings.