
XLF VS KIE
Exchange-Traded Funds (ETFs) have transformed the investment landscape, offering investors an efficient way to gain exposure to various sectors and asset classes. In this article, we will conduct an in-depth comparison between two prominent ETFs: XLF (Financial Select Sector SPDR Fund) and KIE (SPDR S&P Insurance ETF). We will delve into key aspects, including ETF tickers, full names, issuers, sectors, top holdings, capitalization, investment strategy, tracking methods, and exposure.
XLF Vs KIE: Overview
XLF and KIE represent two distinct investment options within the financial sector. While XLF focuses on the broader financial services industry, KIE zeroes in on the insurance sector. By understanding the core differences between these two ETFs, investors can make more informed decisions aligned with their financial goals and risk tolerance.
XLF Vs KIE: Sectors and Top Holdings
XLF is designed to mirror the performance of financial companies listed on the S&P 500, encompassing banks, diversified financial services, and insurance firms. On the other hand, KIE provides exposure exclusively to insurance companies like The Travelers Companies, Allstate Corporation, and Progressive Corporation. Analyzing the sectors and top holdings enables investors to assess the potential returns and risks associated with each ETF.
 XLF overlap XLF VS KIE
XLF Vs KIE: Capitalization and Investment Strategy
XLF boasts a substantial asset under management (AUM), reflecting its popularity among investors seeking broad financial sector exposure. KIE, with its exclusive focus on insurance companies, provides a more targeted approach. The distinct capitalization and investment strategies between these ETFs result in varying risk-return profiles, necessitating thorough evaluation before making investment decisions.
XLF Vs KIE: Tracking Methods and Exposure
XLF tracks an index of financial sector stocks, aiming to replicate the performance of the Financial Select Sector Index. KIE, as an insurance-focused ETF, follows an index composed of insurance companies' stocks. Understanding the tracking methods and exposure strategies is crucial for investors looking to align their portfolio with specific market segments and trends.
Conclusion
XLF and KIE are noteworthy ETFs that cater to investors seeking exposure to different aspects of the financial sector. Whether you're interested in the broader financial services industry or specifically in insurance companies, these ETFs offer targeted avenues for investment. For those interested in delving deeper into the intricacies of holdings, correlations, overlaps, and various insights, ETF Insider provides an invaluable tool. With its user-friendly app, investors gain access to comprehensive information on these and other financial instruments.
Disclaimer: This article does not provide investment advisory services.
Sources:
ETF issuers' official websites and prospectuses
Financial news and analysis platforms
ETF tracking and performance data from reliable financial sources
XLF quote and analysis
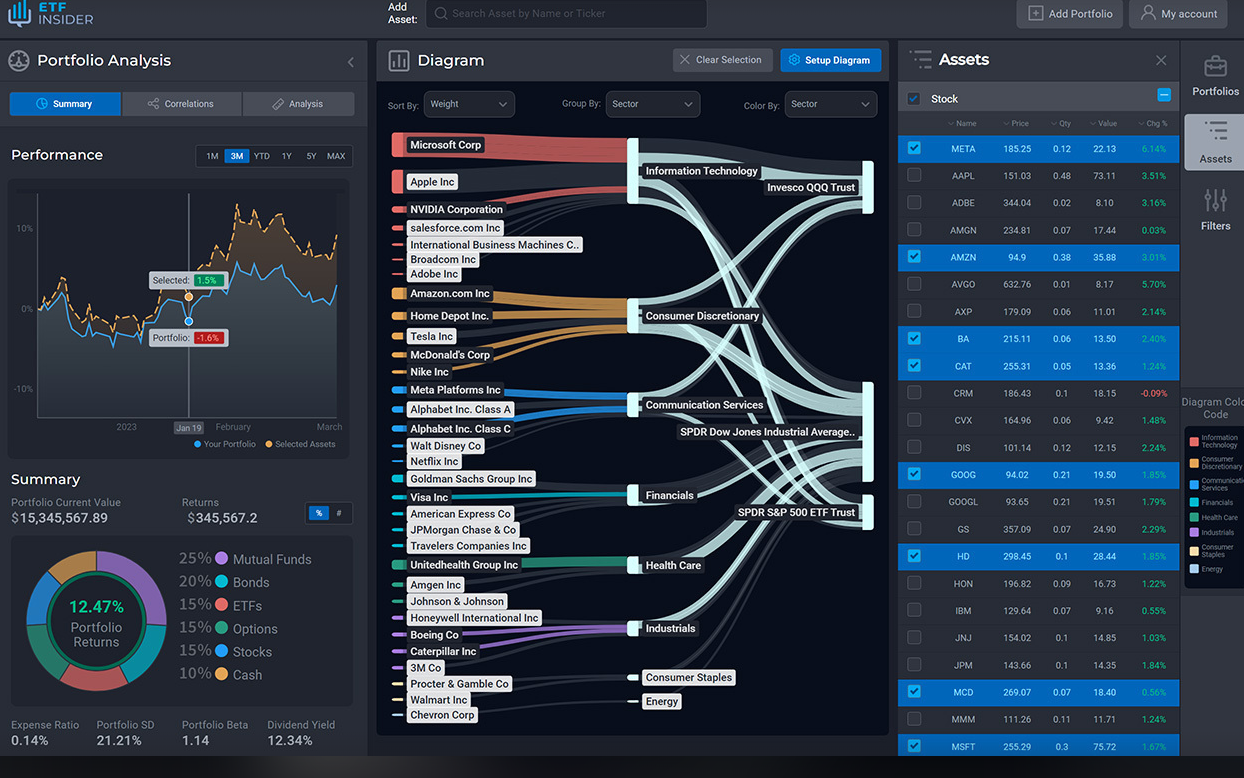
Discover the top holdings, correlations, and overlaps of ETFs using our visualization tool.
Our app allows you to build and track your portfolio.
To learn more about the XLF Financial Select Sector SPDR Fund, access our dedicated page now.
FAQ
Why is XLF better than KIE?
XLF may be considered better than KIE for some investors due to its specific focus, offering diversification.
Does KIE beat XLF?
KIE's performance relative to XLF will vary over time, depending on market conditions.
Should I invest in XLF or KIE?
The choice between XLF and KIE should align with your investment goals, risk tolerance, and desired exposure.
Are XLF and KIE good investments?
Both XLF and KIE can be suitable investments depending on individual investment strategies, goals, and risk profiles.
What is the correlation between XLF and KIE?
The correlation between XLF and KIE can vary over time, reflecting differences in performance.
Related blog posts

What is XLF in stock market?
In the stock market, XLF refers to the ticker symbol for the Financial Select Sector SPDR Fund. This exchange-traded fund (ETF) tracks the performance of the financial sector in the S&P 500 index. It provides investors with exposure to a diversified portfolio of financial companies such as banks, insurance companies, and diversified financial services firms.

What stocks are in XLF?
The XLF (Financial Select Sector SPDR Fund) is an exchange-traded fund (ETF) that seeks to track the performance of the financial sector in the S&P 500 Index. As of my knowledge cutoff in September 2021, some of the major holdings in XLF included top financial institutions such as JPMorgan Chase & Co., Bank of America Corporation, and Wells Fargo & Company. XLF provides investors with exposure to a diversified portfolio of financial stocks, allowing them to participate in the performance of the broader financial industry. Please note that the composition of the fund may have changed since my knowledge cutoff, and it's advisable to check the latest holdings before making any investment decisions.
What are the risks associated with investing in XLF?
Investing in XLF, which is the Financial Select Sector SPDR Fund, carries certain risks. One risk is the volatility of the financial sector, which can be influenced by factors such as interest rate changes, economic conditions, and regulatory changes. Additionally, individual stocks within the fund may face specific risks, such as credit risk, default risk, or market risk, which can impact the overall performance of XLF. It is important for investors to carefully assess these risks and diversify their portfolio accordingly.

XLF VS IYF
Compare the XLF and IYF ETFs with our thorough analysis. Dive into the performance metrics, underlying assets, and investment strategies to see how they stack up against each other. Whether you're a seasoned investor or just getting started, our comparison provides valuable insights to guide your investment decisions.

XLF VS VFH
Compare the XLF and VFH ETFs with our thorough analysis. Dive into the performance metrics, underlying assets, and investment strategies to see how they stack up against each other. Whether you're a seasoned investor or just getting started, our comparison provides valuable insights to guide your investment decisions.

XLF VS IXG
Compare the XLF and IXG ETFs with our thorough analysis. Dive into the performance metrics, underlying assets, and investment strategies to see how they stack up against each other. Whether you're a seasoned investor or just getting started, our comparison provides valuable insights to guide your investment decisions.

XLF VS KBWB
Compare the XLF and KBWB ETFs with our thorough analysis. Dive into the performance metrics, underlying assets, and investment strategies to see how they stack up against each other. Whether you're a seasoned investor or just getting started, our comparison provides valuable insights to guide your investment decisions.

XLF VS KIE
Compare the XLF and KIE ETFs with our thorough analysis. Dive into the performance metrics, underlying assets, and investment strategies to see how they stack up against each other. Whether you're a seasoned investor or just getting started, our comparison provides valuable insights to guide your investment decisions.

XLF VS IAT
Compare the XLF and IAT ETFs with our thorough analysis. Dive into the performance metrics, underlying assets, and investment strategies to see how they stack up against each other. Whether you're a seasoned investor or just getting started, our comparison provides valuable insights to guide your investment decisions.

XLF VS FNCL
Compare the XLF and FNCL ETFs with our thorough analysis. Dive into the performance metrics, underlying assets, and investment strategies to see how they stack up against each other. Whether you're a seasoned investor or just getting started, our comparison provides valuable insights to guide your investment decisions.

XLF VS KBWR : ETF Comparison Tool
Compare the XLF and KBWR ETFs with our thorough analysis. Dive into the performance metrics, underlying assets, and investment strategies to see how they stack up against each other. Whether you're a seasoned investor or just getting started, our comparison provides valuable insights to guide your investment decisions.

XLF VS RYF
Compare the XLF and RYF ETFs with our thorough analysis. Dive into the performance metrics, underlying assets, and investment strategies to see how they stack up against each other. Whether you're a seasoned investor or just getting started, our comparison provides valuable insights to guide your investment decisions.

XLF VS PSCF
Compare the XLF and PSCF ETFs with our thorough analysis. Dive into the performance metrics, underlying assets, and investment strategies to see how they stack up against each other. Whether you're a seasoned investor or just getting started, our comparison provides valuable insights to guide your investment decisions.

XLF VS FXO
Compare the XLF and FXO ETFs with our thorough analysis. Dive into the performance metrics, underlying assets, and investment strategies to see how they stack up against each other. Whether you're a seasoned investor or just getting started, our comparison provides valuable insights to guide your investment decisions.

XLF VS IAK
Compare the XLF and IAK ETFs with our thorough analysis. Dive into the performance metrics, underlying assets, and investment strategies to see how they stack up against each other. Whether you're a seasoned investor or just getting started, our comparison provides valuable insights to guide your investment decisions.

XLF VS DPST
Compare the XLF and DPST ETFs with our thorough analysis. Dive into the performance metrics, underlying assets, and investment strategies to see how they stack up against each other. Whether you're a seasoned investor or just getting started, our comparison provides valuable insights to guide your investment decisions.

XLF VS WDRW
Compare the XLF and WDRW ETFs with our thorough analysis. Dive into the performance metrics, underlying assets, and investment strategies to see how they stack up against each other. Whether you're a seasoned investor or just getting started, our comparison provides valuable insights to guide your investment decisions.

XLF VS KRE
Compare the XLF and KRE ETFs with our thorough analysis. Dive into the performance metrics, underlying assets, and investment strategies to see how they stack up against each other. Whether you're a seasoned investor or just getting started, our comparison provides valuable insights to guide your investment decisions.

XLF VS PFI
Compare the XLF and PFI ETFs with our thorough analysis. Dive into the performance metrics, underlying assets, and investment strategies to see how they stack up against each other. Whether you're a seasoned investor or just getting started, our comparison provides valuable insights to guide your investment decisions.

IYF VS KIE
Compare the IYF and KIE ETFs with our thorough analysis. Dive into the performance metrics, underlying assets, and investment strategies to see how they stack up against each other. Whether you're a seasoned investor or just getting started, our comparison provides valuable insights to guide your investment decisions.

VFH VS KIE
Compare the VFH and KIE ETFs with our thorough analysis. Dive into the performance metrics, underlying assets, and investment strategies to see how they stack up against each other. Whether you're a seasoned investor or just getting started, our comparison provides valuable insights to guide your investment decisions.

DPST VS XLF: Capitalization Strategy
In the DPST vs. XLF showdown, the choice ultimately depends on your investment objectives and risk tolerance. Consider utilizing ETF Insider.

WDRW VS XLF
Compare the WDRW and XLF ETFs with our thorough analysis. Dive into the performance metrics, underlying assets, and investment strategies.

Does XLF pay dividends?
The Financial Select Sector SPDR Fund (XLF) is an exchange-traded fund (ETF) that tracks the performance of the financial sector in the S&P 500 Index. As an ETF, XLF does not directly pay dividends to its investors. Instead, it distributes any dividends it receives from the underlying stocks held in the fund to its shareholders on a periodic basis. Therefore, XLF investors may receive dividends indirectly through the fund's dividend distribution.

Exposure to international financial companies
We will delve into the details of XLF's composition, discussing its concentration on domestic financial companies and suggesting potential alternatives.
FNCL VS XLF
Compare the FNCL and XLF ETFs with our thorough analysis. Dive into the performance metrics, underlying assets, and investment strategies.

FXO VS XLF
Compare the FXO and XLF ETFs with our thorough analysis. Dive into the performance metrics, underlying assets, and investment strategies.

How does the XLF ETF work?
The XLF ETF is a specialized investment fund that focuses on a specific sector. This exchange-traded fund offers investors exposure to a range of companies in this sector.

IAK VS XLF
Compare the IAK and XLF ETFs with our thorough analysis. Dive into the performance metrics, underlying assets, and investment strategies.

IAT VS XLF
Compare the IAT and XLF ETFs with our thorough analysis. Dive into the performance metrics, underlying assets, and investment strategies.

Investing in the financial sector
By considering alternative financial sector ETFs & funds, investors can gain exposure to different segments of the industry & enhance investment portfolios.

IXG VS XLF
Compare the IXG and XLF ETFs with our thorough analysis. Dive into the performance metrics, underlying assets, and investment strategies.

KBE VS XLF
Compare the KBE and XLF ETFs with our thorough analysis. Dive into the performance metrics, underlying assets, and investment strategies.

KBWB VS XLF
Compare the KBWB and XLF ETFs with our thorough analysis. Dive into the performance metrics, underlying assets, and investment strategies.
KBWR VS XLF
Compare the KBWR and XLF ETFs with our thorough analysis. Dive into the performance metrics, underlying assets, and investment strategies.

KCE VS XLF
Compare the KCE and XLF ETFs with our thorough analysis. Dive into the performance metrics, underlying assets, and investment strategies.

KIE VS IYF
Compare the KIE and IYF ETFs with our thorough analysis. Dive into the performance metrics, underlying assets, and investment strategies.

KIE VS VFH
Compare the KIE and VFH ETFs with our thorough analysis. Dive into the performance metrics, underlying assets, and investment strategies.

KIE VS XLF
Compare the KIE and XLF ETFs with our thorough analysis. Dive into the performance metrics, underlying assets, and investment strategies.

KRE VS XLF
Compare the KRE and XLF ETFs with our thorough analysis. Dive into the performance metrics, underlying assets, and investment strategies.

PFI VS XLF
Compare the PFI and XLF ETFs with our thorough analysis. Dive into the performance metrics, underlying assets, and investment strategies.

PSCF VS XLF
Compare the PSCF and XLF ETFs with our thorough analysis. Dive into the performance metrics, underlying assets, and investment strategies.

QABA VS XLF
Compare the QABA and XLF ETFs with our thorough analysis. Dive into the performance metrics, underlying assets, and investment strategies.

RYF VS XLF
Compare the RYF and XLF ETFs with our thorough analysis. Dive into the performance metrics, underlying assets, and investment strategies.

VFH VS XLF
Compare the VFH and XLF ETFs with our thorough analysis. Dive into the performance metrics, underlying assets, and investment strategies.