
FXI VS PEK: A Comprehensive Comparison of ETFs
Exchange-Traded Funds (ETFs) have transformed the investment landscape, providing investors with diversified exposure to various sectors and asset classes. In this article, we will conduct an in-depth comparison between two prominent ETFs: FXI (iShares China Large-Cap ETF) and PEK (VanEck Vectors ChinaAMC CSI 300 ETF). We'll explore key aspects including ETF tickers, full names, issuers, sectors, top holdings, capitalization, strategy, tracking, and exposure.
FXI VS PEK: Overview
FXI and PEK represent distinct approaches to investing in Chinese equities. While FXI tracks the performance of large-cap Chinese stocks, PEK focuses on replicating the CSI 300 Index, which consists of 300 A-share stocks listed on the Shanghai and Shenzhen stock exchanges. The differences in their underlying indices shape their exposures and investment strategies.
FXI VS PEK: Sectors and Top Holdings
FXI provides exposure to a broad range of sectors within the Chinese economy, including financials, technology, and consumer goods. Its top holdings include companies like Tencent, Alibaba, and China Construction Bank. On the other hand, PEK's holdings are selected from the CSI 300 Index constituents, providing a diverse representation of industries such as financials, industrials, and healthcare. Understanding the sectors and top holdings helps investors assess the potential risks and rewards of each ETF.
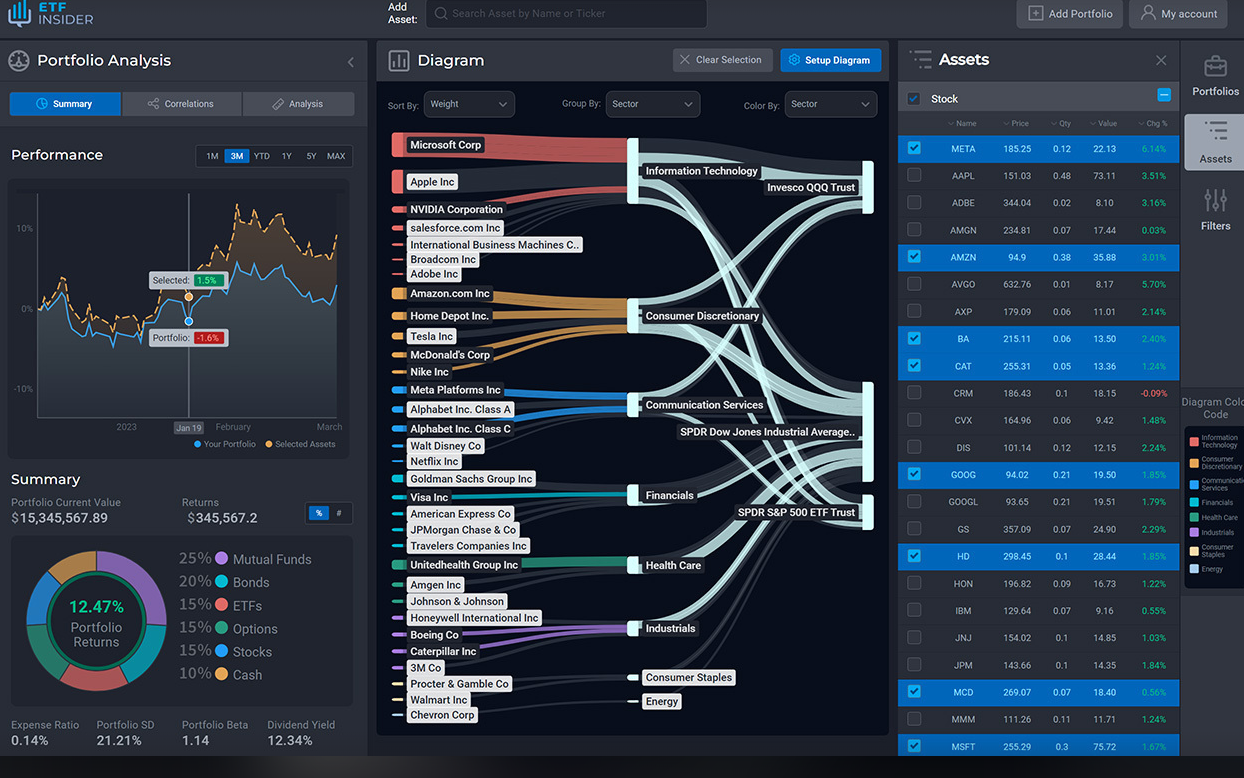 FXI overlap FXI VS PEK: A Comprehensive Comparison of ETFs
FXI VS PEK: Capitalization and Strategy
FXI boasts a substantial asset under management (AUM) due to its popularity among investors seeking exposure to China's large-cap market. PEK's strategy is centered around closely tracking the performance of the CSI 300 Index, which represents a significant portion of the Chinese A-share market. The differences in capitalization and investment strategy contribute to the distinct risk-return profiles of these ETFs.
FXI VS PEK: Tracking and Exposure
FXI seeks to mirror the performance of the FTSE China 50 Index, which includes some of the largest and most liquid Chinese companies. On the other hand, PEK aims to replicate the CSI 300 Index, which covers a broader spectrum of Chinese A-share stocks. FXI's exposure is more concentrated on a smaller number of prominent companies, while PEK offers a broader representation of the Chinese equity market.
Conclusion
FXI and PEK cater to investors looking to capitalize on China's economic growth and expanding equity markets. The choice between these ETFs depends on factors such as desired exposure, risk tolerance, and investment goals. For those seeking deeper insights into holdings, correlations, overlaps, and other financial instruments, ETF Insider provides a valuable tool. With its user-friendly app, investors can access comprehensive details to make informed decisions.
Disclaimer: This article does not provide any investment advisory services.
Sources:
iShares. (n.d.). iShares China Large-Cap ETF (FXI). Retrieved from [link]
VanEck. (n.d.). VanEck Vectors ChinaAMC CSI 300 ETF (PEK). Retrieved from [link]
FXI ETF issuer
FXI ETF official page
FXI quote and analysis
Discover the top holdings, correlations, and overlaps of ETFs using our visualization tool.
Our app allows you to build and track your portfolio.
To learn more about the FXI iShares China Large-Cap ETF, access our dedicated page now.
Related blog posts

What are the Best Asian ETFs to Invest in
When it comes to investing in Asian markets, ETFs can provide a convenient way to gain exposure to the region's diverse economies and sectors.

What are the best ETFs to invest in China?
Discover the top-performing exchange-traded funds (ETFs) that offer excellent opportunities for investing in the dynamic Chinese market. This article provides insights into the best ETFs available, highlighting their performance, underlying assets, and potential for long-term growth. Whether you're a seasoned investor or new to the world of ETFs, this guide will help you navigate the Chinese investment landscape with confidence.

MCHI VS FXI: A Comparison of ETFs
MCHI and FXI are both ETFs focused on the Chinese market, but they differ in their specific investment approaches. Explore this article to gain insights.

MCHI VS PEK: A Comprehensive Comparison of ETFs
MCHI VS PEK are specialized investment funds that focus on a diverse range of sectors in the financial market. these exchange-traded funds offer investors exposure to various industries and companies, presenting potential growth opportunities and risks. it's essential to understand the underlying assets and strategies of these etfs before considering an investment.

FXI VS PEK: A Comprehensive Comparison of ETFs
FXI VS PEK are specialized investment funds that focus on a diverse range of sectors in the financial market. these exchange-traded funds offer investors exposure to various industries and companies, presenting potential growth opportunities and risks. it's essential to understand the underlying assets and strategies of these etfs before considering an investment.

FXI VS KWEB: A Comprehensive Comparison of ETFs
FXI VS KWEB are specialized investment funds that focus on a diverse range of sectors in the financial market. these exchange-traded funds offer investors exposure to various industries and companies, presenting potential growth opportunities and risks. it's essential to understand the underlying assets and strategies of these etfs before considering an investment.

FXI VS CNXT: A Comprehensive Comparison of ETFs
FXI VS cnxt are specialized investment funds that focus on a diverse range of sectors in the financial market. these exchange-traded funds offer investors exposure to various industries and companies, presenting potential growth opportunities and risks. it's essential to understand the underlying assets and strategies of these etfs before considering an investment.

GXC VS PEK: A Comprehensive Comparison of ETFs
GXC VS PEK are specialized investment funds that focus on a diverse range of sectors in the financial market. these exchange-traded funds offer investors exposure to various industries and companies, presenting potential growth opportunities and risks. it's essential to understand the underlying assets and strategies of these etfs before considering an investment.

PEK VS ASHR: A Comprehensive Comparison of ETFs
PEK VS ASHR are specialized investment funds that focus on a diverse range of sectors in the financial market. these exchange-traded funds offer investors exposure to various industries and companies, presenting potential growth opportunities and risks. it's essential to understand the underlying assets and strategies of these etfs before considering an investment.

PEK VS CNXT: A Comprehensive Comparison of ETFs
PEK VS cnxt are specialized investment funds that focus on a diverse range of sectors in the financial market. these exchange-traded funds offer investors exposure to various industries and companies, presenting potential growth opportunities and risks. it's essential to understand the underlying assets and strategies of these etfs before considering an investment.

PEK VS KWEB: A Comprehensive Comparison of ETFs
PEK VS KWEB are specialized investment funds that focus on a diverse range of sectors in the financial market. these exchange-traded funds offer investors exposure to various industries and companies, presenting potential growth opportunities and risks. it's essential to understand the underlying assets and strategies of these etfs before considering an investment.